FAIRLIGHT / FINAL MIX / METERING · 11
Frequency Analyzer
Locate the frequency. Test the cause by listening.
Locate hum, follow a short ring and compare speech with music. Read Spectrum and Waterfall, establish the measurement point and test a hypothesis on one passage. The teaching generator shows how frequencies, harmonics and the analysis window form a spectrum.
- 01Separate frequency, level and history
- 02Check hum and masking in context
- 03Connect FFT results with measurement limits
Change frequency and harmonic level relative to the fundamental. Compare the test spectrum with the pure fundamental.
Locate energy by frequency.↗
Move the fundamental and the calculated peak moves with it. The diagram marks the requested frequency and the largest bin of a finite FFT; they can differ.
Check: a bin frequency has not been mistaken for the exact frequency of every tone.Change the controls to explore the diagram. No audio playback, native DSP or connection to Resolve.
Sources and scope · 9 October 2026
Reviewed on 9 October 2026 against the complete DaVinci Resolve 21 Reference Manual: chapter 181, Frequency Analyzer, page 4115. Text and Spectrum/Waterfall panels were inspected; physical and printed page numbers match. Track, bus and Meter context was checked on pages 4130–4132. The original article image URL is preserved. This manual section does not specify native Analyzer FFT size, window, amplitude calibration, averaging or hold. The lab calculates an authored mono signal; its controls, history and dBFS calibration are not presented as the Resolve algorithm. It does not play or process your recording.
Read the source notes ↓On this page
01 / UNDERSTAND & APPLY
Turn an audible problem into a testable question
Frequency Analyzer describes a signal by frequency. The Resolve 21 manual presents it as a way to examine clips and tracks through Spectrum and Waterfall views. It supports subsequent processing: the graph does not decide which tone suits the scene or whether the recording needs changing.
Start with a concrete observation: the low end hums in a pause, one vowel rings, music covers a word, or processing has removed useful tone. Then ask where and when the associated energy appears. A short repeatable passage and one hypothesis make the comparison easier to interpret.
Frequency
The horizontal position helps locate a region. Several peaks can belong to one musical or spoken sound; their number does not tell you how many problems exist.
Level
Spectrum height depends on both signal content and overall level. Before comparing shapes, establish that the passages and the point in the signal chain are comparable.
Time
A continuous background and a short ring call for different observations. History helps when one frozen view obscures the onset or duration of the event.
Reference: Blackmagic Design — DaVinci Resolve 21 Reference Manual · Frequency Analyzer
02 / UNDERSTAND & APPLY
Read the native panel without guessing its algorithm
Page 4115 of the official manual shows Spectrum and Waterfall. Mode is at the upper right. The text identifies the full frequency range as the default and lists Low, Midrange and High close-up views; the illustration labels the full view Full Spectrum.
The illustrated panel has horizontal labels from 20 Hz to 24 kHz and Spectrum level labels from 0 to −80 dB. That describes the shown scale. It does not establish the sample rate of the entire project, a human hearing limit or the internal detector calibration.
| Element | What is documented | How to use it |
|---|---|---|
| Mode / Full Spectrum | Full frequency range; the default. | Start with the overall distribution, then choose a region. |
| Low / Midrange / High | Close-up frequency views. | Inspect a region; do not supply exact boundaries from memory. |
| Spectrum | The spectrum view. | Compare frequencies and levels in the selected passage. |
| Waterfall | A spectrum view with history. | Observe which components persist or change over time. |
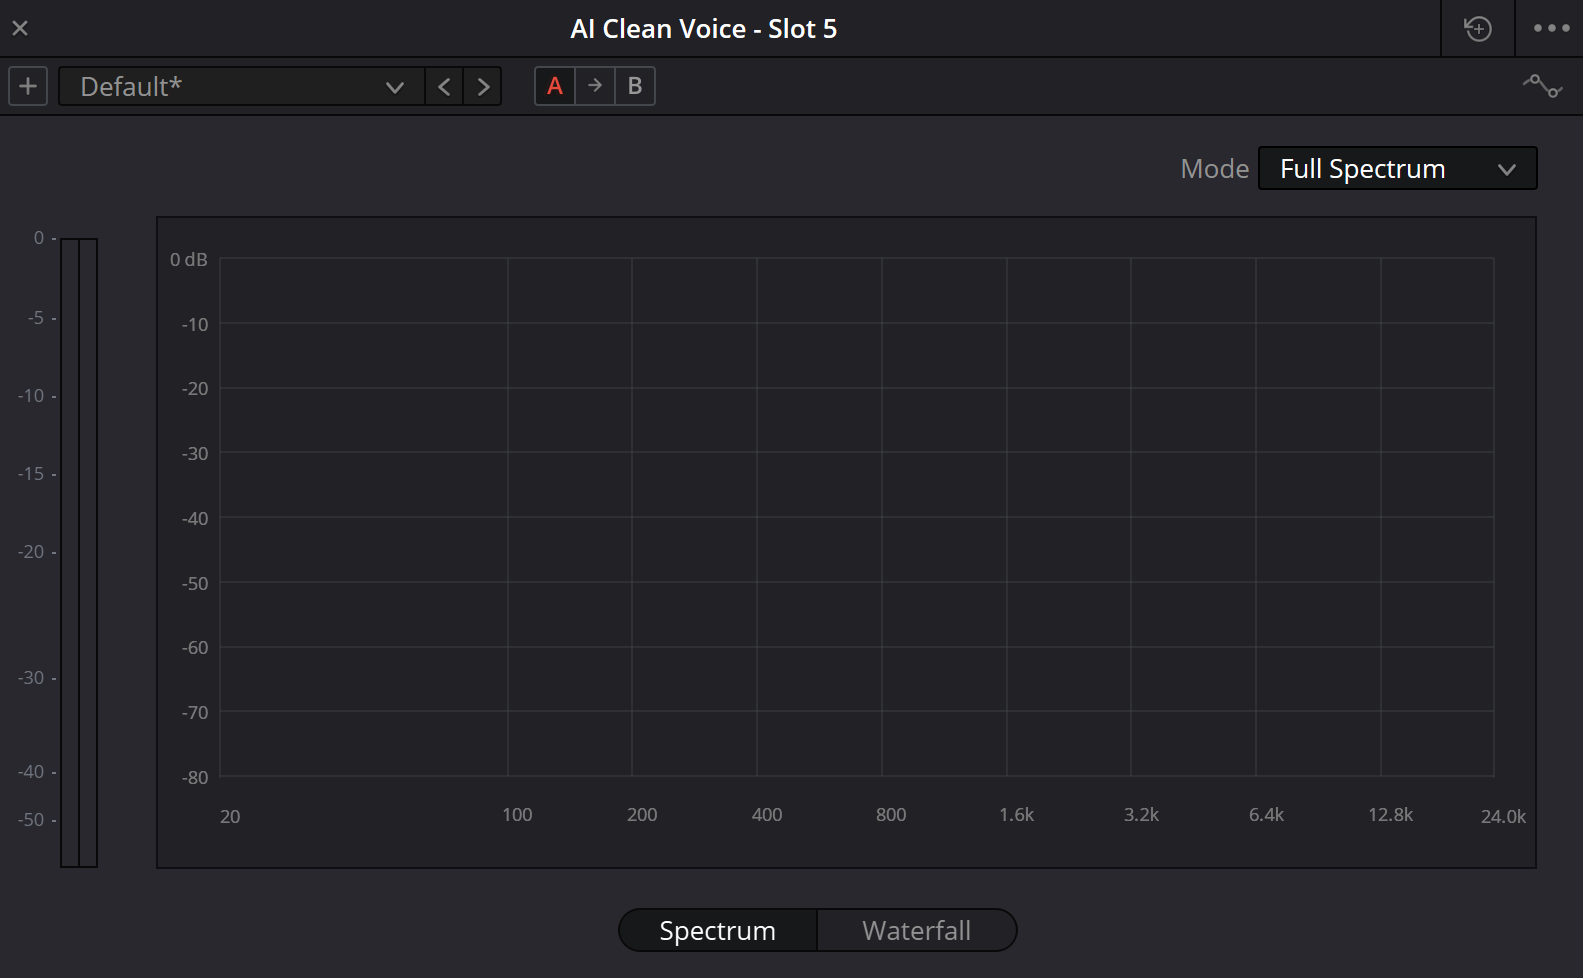
Frequency Analyzer · original interface illustration
The original article illustration is retained. Native Spectrum, Waterfall and Mode were checked separately against page 4115 of the Resolve 21 manual. One captured graph state does not establish signal presence, routing or the measurement method.
Reference: Blackmagic Design — DaVinci Resolve 21 Reference Manual · Frequency Analyzer
03 / UNDERSTAND & APPLY
Read the spectrum together with its axes
On a logarithmic frequency axis, equal distances represent equal frequency ratios. Low frequencies therefore occupy useful width, while the harmonics of one tone appear progressively closer together toward the right. Read numerical frequencies when carrying an observation into another tool.
A peak means relatively strong energy in the displayed region. Its width and height depend on the analysis as well as the source. In the teaching FFT, an isolated sine between bins spreads energy into neighbouring values; changing the window changes the drawing without changing the original sine.
| Observation | Working hypothesis | What else to check |
|---|---|---|
| A narrow, stable rise | A tone, resonance or hum component. | Whether it persists in pauses and changes with a note or source position. |
| Several regularly spaced peaks | A fundamental and its harmonics. | Numerical frequencies and their relationship to useful sound; regularity does not prove interference. |
| Energy across a broad region | Complex tone, noise or overlapping sources. | Individual tracks, pauses and changes over time. |
| A low trace or an empty field | A quiet signal, a pause or the wrong observation point. | Transport, clip selection, routing, Mute/Solo and a neighbouring level meter. |
04 / UNDERSTAND & APPLY
Choose Full, Low, Midrange or High for the question
Begin with Full Spectrum to keep the overall balance in view. Once you know where to investigate, choose the relevant Mode region. A close-up helps you read that region; it does not by itself prove a higher internal frequency resolution.
Return to matching views before comparing versions. A different scale can make a passage appear more detailed or more problematic even when the signal is unchanged. Record Mode with the time range and source name, especially when passing an observation to another editor.
Low
Inspect low hum, impacts and sustained low components. Relate them to pauses and scene events; a low frequency may belong to music or an intended effect.
Midrange
Investigate a suspected ring or the overlap between speech and music. Then restore the whole mix: an isolated spectrum does not establish whether a word is intelligible.
High
Follow brief high-frequency bursts, hiss and changes to the top end after processing. Compare consonants and useful attacks before reducing the whole region.
Reference: Blackmagic Design — DaVinci Resolve 21 Reference Manual · Frequency Analyzer
05 / UNDERSTAND & APPLY
Use Waterfall to inspect duration and repetition
Waterfall adds a sequence of spectral slices. The native illustration in the manual shows these layers, making it possible to follow component behaviour. One persistent trail and a series of brief bursts suggest different questions for the next check.
First locate the event on the timeline. Listen to its approach, the event itself and its tail. Without that context, a long trail can be mistaken for a defect even when it belongs to room reverberation, a musical note or the intended sound design.
Persistent trail
Does the frequency continue during both speech and pauses? This helps distinguish a stationary component from harmonics that follow the voice.
Brief burst
Does it coincide with a consonant, an impact or an edit? Listen locally and in context, then decide whether only that event needs treatment.
Decaying trail
How long does a ring remain audible after the attack? Relate its end to the acoustics and the edit. History reveals continuation but does not choose the corrective tool.
Reference: Blackmagic Design — DaVinci Resolve 21 Reference Manual · Frequency Analyzer
06 / UNDERSTAND & APPLY
Measure the same signal at the same point
A clip spectrum, a track spectrum and a complete mix answer different questions. Temporarily isolating a track can help identify a source; restore the full context to judge the result. The manual separately describes bus meters as observing the sum of tracks assigned to each bus.
Establish the analyzer position in the chain before comparing processing. If you observe the signal before the changed effect, the graph can remain unchanged. A panel image alone cannot establish this order or prove that the observed bus is the selected export output.
Name the source
Record the clip, track or bus, channel and time range. For multichannel material, establish which channel or sum is actually being observed.
Check the chain
Locate the analyzer relative to EQ, restoration and output gain. To judge processing, the observation must be on the relevant side of that change.
Confirm signal presence
Replay the passage and relate listening to a level meter. Check Mute, Solo, clip selection and assignments when the display does not match expectations.
Keep conditions consistent
Use the same passage, Mode and route after editing. Then remove temporary Solo and repeat the check on the complete mix.
Reference: Blackmagic Design — DaVinci Resolve 21 Reference Manual · Frequency Analyzer · Blackmagic Design — DaVinci Resolve 21 Reference Manual · Meter and Audio Metering
07 / UNDERSTAND & APPLY
Separate low background, hum and useful harmonics
Low background can be sustained and broad, while hum often has more tonal components. Inspect a pause: a frequency that persists when the voice stops strengthens the hypothesis of an independent background. The spectrum still cannot name its source; ventilation, vibration and room sound need listening and investigation.
Frequencies near 50 or 60 Hz and their integer multiples can direct a search for mains interference. Those same individual frequencies can occur in useful material. Check their persistence, their relationship to the music and what you hear after one small trial change in a test copy.
| Situation | How to check | A useful next step |
|---|---|---|
| Diffuse low energy in pauses | Compare several pauses with active speech on the same track. | Investigate the background and cautiously reduce unwanted lows while retaining voice body. |
| A stable set of narrow components | Record frequencies and test their multiples against the suspected hum fundamental. | Read the De-Hummer lesson and judge the result by the useful signal. |
| Peaks follow a note or vowel | Follow their timing and listen to the source separately. | Initially treat them as tone; process only a confirmed problem. |
08 / UNDERSTAND & APPLY
Inspect speech and music without a universal intelligibility band
When music covers dialogue, the problem can change from word to word. Compare speech alone, music alone and their sum over the same passage. Frequency overlap gives a direction to investigate, but two spectra occupying one region does not measure the degree of audible masking.
Do not apply one identical cut to every voice and arrangement. First check balance and the timing of the competing event. Local level automation may be enough; another passage may benefit from a small tonal change or treatment of one source. The full mix must be restored before deciding.
One difficult line
Choose the words that actually disappear. Identify musical attacks or effects that coincide with them, rather than judging only an average picture of the scene.
Sibilants and attacks
Brief high-frequency energy may be a normal consonant or instrument attack. Confirm unwanted harshness by listening and check whether a local change improves it.
Context after the change
Restore music, effects and neighbouring lines. Confirm that words read clearly, music keeps its role and the transition does not reveal distracting processing movement.
09 / UNDERSTAND & APPLY
Choose processing for the audible problem
Persistent broad energy in a pause differs from one tonal ring. Compare the noisy section with useful sound before restoration. Do not treat the bottom of a plotted trace as an exact noise-floor measurement: scale, window and display method also shape its appearance.
After restoration, the spectrum helps locate changes, but reduced high-frequency content does not prove improvement. Listen to breaths, word endings, attacks and tails. A metallic tone or lost detail can matter more than a visually calmer line.
| Confirmed task | Where to continue | What to preserve in the check |
|---|---|---|
| Tonal balance or a local ring | Equalizer. | Useful tone, neighbouring sounds and scene balance. |
| Stationary hum with harmonics | De-Hummer. | Useful low content and freedom from new artifacts. |
| A broader noise component | Noise Reduction. | Consonants, breaths, attacks and natural decay. |
| Final programme loudness | Loudness Meter. | The complete programme range and delivery requirements. |
10 / UNDERSTAND & APPLY
Lab: from specified samples to a spectrum
This FFT is calculated from a finite authored signal: 48 kHz, 1024 samples per block, nine adjacent blocks. Change the fundamental, second and third harmonics, gain, source type and window. These controls belong to the teaching generator and analysis; they are not Frequency Analyzer controls in Resolve.
Start at 750 Hz, which coincides with a bin. Then select 1000 Hz and compare Hann with the rectangular window. Inspect the maximum, neighbouring bins and distant leakage. For history, choose the burst, inspect indices 0, 4 and 8, and compare silence with the envelope centre.
Build a signal. See where its energy appears.
A real FFT of an authored signal links the generator to the drawing. Change the fundamental, harmonic level or window, then inspect one of nine adjacent blocks. The history is calculated from that same sequence; no audio is playing.
Block 5/9, 85.33–106.67 ms. Current source and gain are analysed. Largest bin: 750 Hz.
Try 750 Hz and 1000 Hz. At 750 Hz, the fundamental sits on bin 16; at 1000 Hz, it falls between bins. Hann reduces distant leakage but broadens the main lobe. A largest-bin readout is not a precise estimate of an off-bin tone frequency.
Drawing range: 20 Hz–24 kHz and −90…+12 dBFS. 503 finite bins below the level range; 0 above it. The first positive-frequency bin is 46.875 Hz; DC is not drawn on the logarithmic axis. Readouts retain the calculated values.
Signal, FFT calibration and history assumptions
Nine consecutive, non-overlapping blocks of 1024 samples form a 192 ms sequence at 48 kHz. Index 0 is the first block; 8 is the last. All nine are shown together; the selector inspects one block and is not a transport. Signal phases continue across block boundaries. No randomness, averaging, peak hold, browser audio or Resolve connection is used.
r = 10^(harmonicDb / 20)
x[n] = 0.25 × 10^(gainDb / 20) × e[n] × (sin(φ) + r sin(2φ) + 0.5r sin(3φ))
φ = 2π × fundamentalHz × n / 48000
X[k] = Σ x[n]w[n] exp(−j2πkn/N)
A[k] = c[k] × |X[k]| / Σw[n] · dBFS = 20 log10(A[k])
For Tone, r is zero. Silence zeros every sample. In the original comparison r and gainDb are zero, with the chosen envelope retained. The burst is zero up to sample 2048 and from sample 7168; between them e[n] = sin²(π(n−2048)/5120). Other non-silent sources use e[n] = 1. The highest generated partial is 12 kHz, below the 24 kHz Nyquist frequency. Samples are not clipped or renormalised.
Periodic Hann uses w[n] = 0.5 − 0.5 cos(2πn/N), coherent gain 0.5. Rectangular uses w[n] = 1, gain 1. Interior one-sided bins have c[k] = 2; DC and Nyquist use 1. This correction returns the peak amplitude of an isolated bin-centred tone; it does not remove off-bin scalloping or turn summed amplitudes into broadband power. Full-scale peak amplitude 1 means 0 dBFS here. This calibration, FFT size and window are our model choices, not documented native Analyzer settings.
11 / UNDERSTAND & APPLY
Compare a change while retaining the passage and level context
Compare the same passage before and after processing at one observation point. Temporarily match perceived level when processing changes it noticeably: a louder version can be mistaken for a clearer one. Separately record the actual measured level change so compensation does not hide that information.
Bypassing the analyzer itself does not create a processed-tone comparison: change the state of the EQ, restoration or other processor being evaluated. The lab original button deliberately removes authored harmonics and gain. It illustrates signal composition rather than native meter-bypass behaviour.
Retain the original observation
Record the frequency region, event time, Mode and audible issue. Note the conditions used for the level comparison.
Change one cause
Make one small adjustment in the chosen processor. If EQ, level and noise reduction all change together, the reason for the result becomes unclear.
Repeat the passage
Compare before and after by listening and by the graph. Inspect neighbouring frequencies, useful attacks and the end of the event.
Restore the actual scene
Remove temporary Solo and compensation that do not belong in the intended mix. Check final levels, transitions and the full sum.
12 / UNDERSTAND & APPLY
Finish with a decision and an output check
A useful analysis result names an action and an observation: for example, a narrow component persisted in pauses, and local treatment reduced it while preserving the voice. That is more useful than saying the spectrum looks better. If the audible problem remains, revisit the hypothesis and measurement point.
Before delivery, check the complete mix, loudness and peaks against the project requirements. Frequency analysis does not replace routing checks, channel-format checks or listening to the exported file. A short control export helps confirm that the intended result reaches the selected output.
| When the result is unclear | Next check |
|---|---|
| The graph did not change after EQ | Establish the side of the chain, processor state, route and repeated passage. |
| The spectrum is flatter but speech is worse | Listen to useful harmonics, consonants and attack; reduce or undo an unconfirmed change. |
| Solo sounds good but a word disappears in the mix | Restore competing sources and check timing, balance and automation. |
| The project and exported file sound different | Check the chosen bus, channels, range and actual exported file. |
PRACTICE / NO AUTOPILOT
A small task. A checkable result.
Work in a test copy, listen before and after, and write down what you actually observed. The checklist contains no pre-approved results.
1 · Record the question and route
In a test copy, choose 10–15 seconds containing the problem and a pause. Record source, track or bus, channel, time boundaries and one audible observation before opening the analysis.
2 · Compare Spectrum and Waterfall
Open Frequency Analyzer on the intended signal. Record Mode and the frequency region. Repeat the passage in both views: what persists, what is brief, and which event does it match?
3 · Test the FFT with a known signal
In the lab, compare 750 with 1000 Hz and Hann with Rectangular. Record requested frequency, largest-bin frequency and amplitude. Raise gain by 6 dB and explain peak position separately from peak height.
4 · Check time, original comparison and silence
Select the burst and indices 0, 4 and 8. Enable original comparison, then return: settings should remain. Check Silence with positive gain and perform a full reset.
5 · Make one change and check the file
In Resolve, correct only the confirmed cause. Compare the same passage under known level conditions, restore the full mix and listen to a control export. Record the actual benefit, side effects and final decision.
FAQ / BEFORE THE NEXT MOVE
Questions that matter in practice
Does Frequency Analyzer fix the sound?
It supplies spectral information for diagnosis. The brief and listening determine useful tone; a chosen processor makes the change. A peak on the graph is not, by itself, an instruction to make an EQ cut.
Reference: Blackmagic Design — DaVinci Resolve 21 Reference Manual · Frequency Analyzer
Should I use Spectrum or Waterfall?
Spectrum helps read the frequency distribution of the observed signal. Waterfall adds history for component onset, repetition and decay. Relate either view to a specific passage; this manual section does not define the precise duration of a native history slice.
Reference: Blackmagic Design — DaVinci Resolve 21 Reference Manual · Frequency Analyzer
Does Full Spectrum mean I should hear up to 24 kHz?
No. 20 Hz–24 kHz are the outer labels on the illustrated manual panel. They do not define your hearing, the sample rate of the entire project or useful content at the right edge. Read them as coordinates of that view.
Reference: Blackmagic Design — DaVinci Resolve 21 Reference Manual · Frequency Analyzer
Does a high peak necessarily mean resonance or hum?
No. It may be a fundamental, a voice harmonic, a musical note or an effect. Check whether the component is unwanted by listening, whether it persists in pauses and how it changes over time. Integer-multiple peaks direct a search but do not identify an interference source.
Why do the 1000 Hz peaks change when I change the window?
The teaching FFT has 46.875 Hz bin spacing, placing 1000 Hz between bins. The window changes leakage and main-lobe width; coherent-gain correction does not remove the between-bin error. The generator frequency remains 1000 Hz.
Can this lab choose between 50 and 60 Hz?
Not reliably from one largest bin: our 46.875 Hz spacing is too coarse for that task. Use the lab to understand limits. Native Frequency Analyzer resolution is not established here; examine real hum with suitable analysis, its harmonics and listening.
Why did the graph stay unchanged after moving a fader or EQ?
First establish the measurement point, processing order and current source. You may be observing before the change, another track or passage, or an inactive processor. One unlabelled panel image cannot establish the cause; repeat a short controlled passage.
Does the lab reproduce the internal Resolve Frequency Analyzer?
No. It computes its stated FFT of an authored mono signal and shows nine specified blocks. FFT size, windows, dBFS calibration, gain and harmonics belong to the teaching model. Native averaging, ballistics, history, true peak, LUFS and recording playback are not modelled.
Reference: Blackmagic Design — DaVinci Resolve 21 Reference Manual · Frequency Analyzer
REFERENCES / 2026-10-09
What this guide is based on
Reviewed on 9 October 2026 against the complete DaVinci Resolve 21 Reference Manual: chapter 181, Frequency Analyzer, page 4115. Text and Spectrum/Waterfall panels were inspected; physical and printed page numbers match. Track, bus and Meter context was checked on pages 4130–4132. The original article image URL is preserved. This manual section does not specify native Analyzer FFT size, window, amplitude calibration, averaging or hold. The lab calculates an authored mono signal; its controls, history and dBFS calibration are not presented as the Resolve algorithm. It does not play or process your recording.
Blackmagic Design — DaVinci Resolve 21 Reference Manual · Meter and Audio Metering ↗
Official full PDF: Fairlight FX Meter on pages 4118 and 4132; metering overview and settings on 4130–4140; Project Settings Audio Metering on 167; Frequency Analyzer on 4115; Phase Meter on 4122. Meter is documented as a sample-peak tool with a separate short hold line and numerical maximum. Project meter types and custom behavior are distinguished from the plug-in menu. Text and panels reviewed on 9 October 2026. The page block RMS is an authored calculation, not a relabeling of native Meter.
Blackmagic Design — DaVinci Resolve 21 Reference Manual · Frequency Analyzer ↗
Full official PDF, chapter 181, page 4115: Frequency Analyzer, Spectrum/Waterfall and Full (default), Low, Midrange and High modes. Text and panels reviewed on 9 October 2026. Native FFT size, window, exact amplitude calibration, hold and averaging are not documented here; the authored model specifies its own algorithm separately.