VIDEO & CAMERAS · LIGHT AND MATERIAL
One white. Not one spectrum.
Two different materials match under D65 in this model. Move toward illuminant A and compare spectra, XYZ and the difference. Then inspect the real CIE TCS09 test-sample dataset.
Read the numbers. Notice the assumptions. Then apply the idea to your footage.
Illuminant spectra, data and limits+
CIE 1931 2° observer, tabulated D65 / A and CIE TCS09. An attributed numerical excerpt from Colour: 81 samples, 380–780 nm, step 5 nm. This is not the full official 1 nm dataset.
The metameric reflectances are constructed here, not measured fabrics. Their D65 match holds for this discrete observer model. The blend fraction is not a Kelvin scale; Bradford does not simulate human adaptation. No CRI, TLCI or SSI is calculated.
XYZ white: 0.9504 · 1.0000 · 1.0888
Computed SDR preview. It cannot reproduce a light source’s spectrum or test your camera. D65 and A are standard illuminants, not product measurements.
 TOPIC ILLUSTRATION
THE ESSENTIAL IDEA
Spectra, metamerism and lighting quality
A similar white does not guarantee similar colour rendering. An object’s colour depends on incident light, spectral reflectance and the system registering the result. Separate these three parts instead of trying to solve every mismatch with white balance.
- Separate colour temperature and white chromaticity from the spectral distribution.
- Understand when an XYZ match stops holding.
- Choose a lighting check instead of substituting one index for the whole test.
A spectrum is not another RGB value
A spectral distribution describes radiation across wavelengths. RGB and XYZ are already a reduction to three numbers under specified rules. The inverse problem is therefore ambiguous: three coordinates do not reconstruct a unique original spectrum. A broad distribution and several narrow bands can produce identical coordinates for a chosen observer.
A digital image normally does not contain a spectrum for each pixel. RGB identifies colour in a stated space, not a lamp recipe or surface reflectance. Converting between RGB spaces translates coordinates; it cannot restore the discarded spectral dimension. Even a colourimetrically accurate display preview does not turn the screen into the original light source.
What this means in practice
Two lamps may produce the same neutral card in a camera but render red fabric differently. Test the fabric, not only the card’s RGB.
What is multiplied before XYZ exists
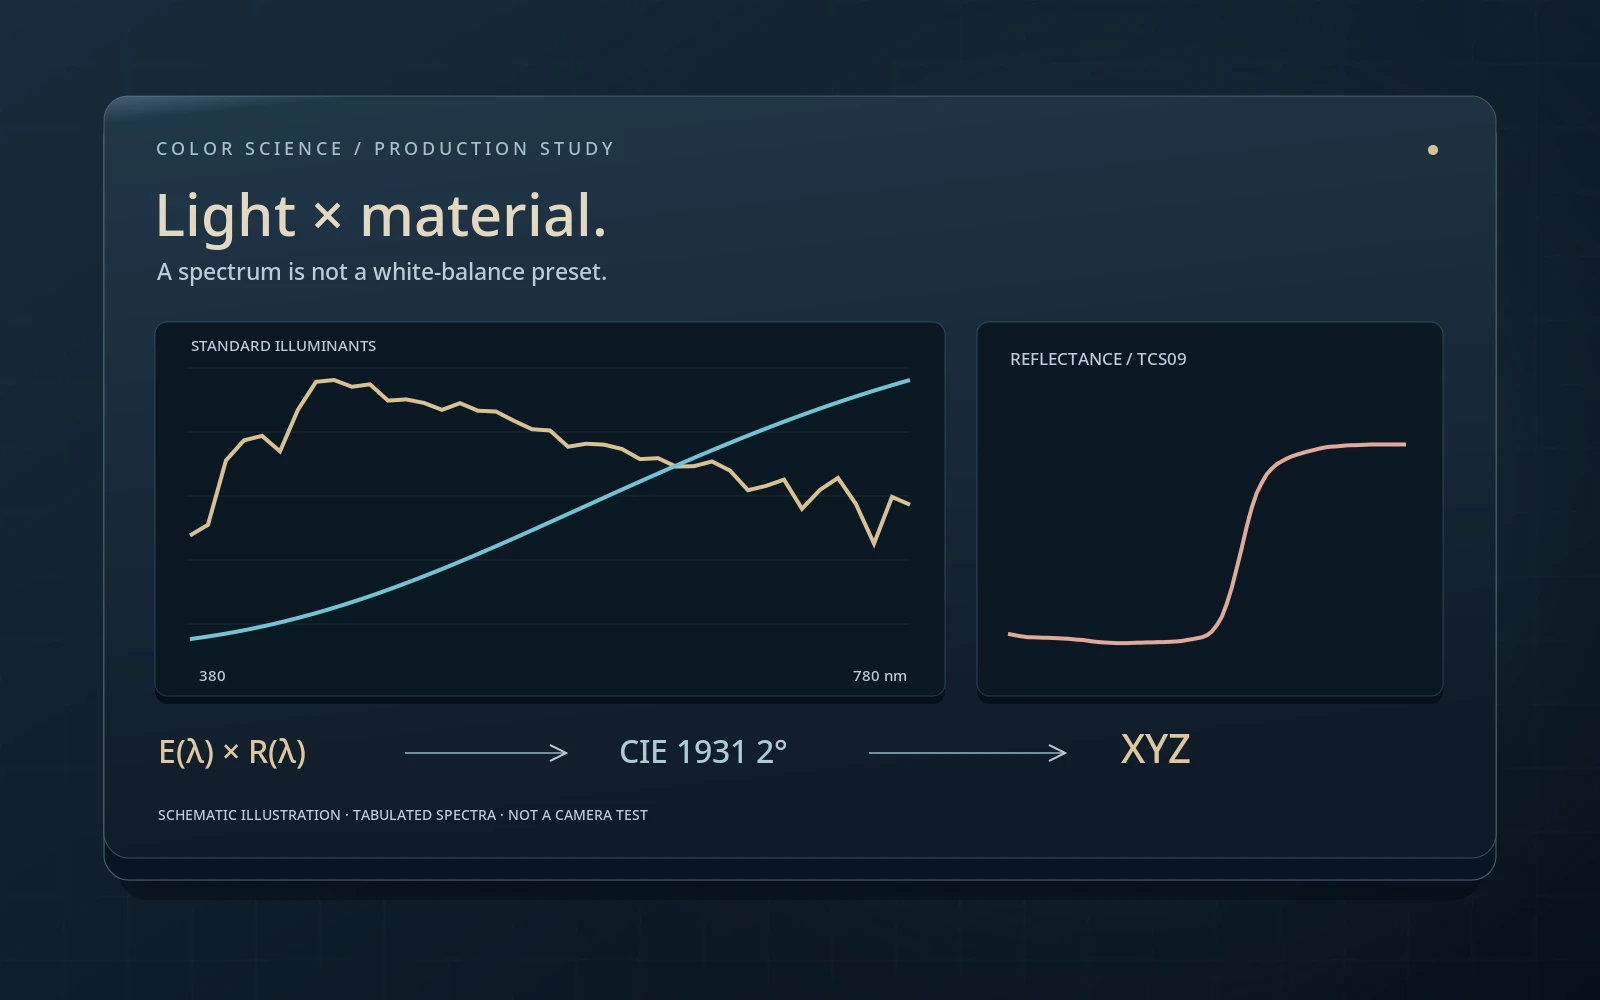
For an ideal diffuse, opaque, nonfluorescent surface, the reflected spectrum is proportional to illuminant E(λ) times reflectance R(λ). Three standard-observer functions weight that result before integration. Our discrete model replaces the integral with a 5 nm sum and normalizes a perfect diffuser to Y = 1 under each selected illuminant.
This compares spectral shape at a consistent photopic white level. It does not measure lux, watts or absolute object luminance. Geometry, directional reflection, specular highlights, transmission and fluorescence are outside this simplified model. Fluorescence can shift radiation between wavelengths, so a single E × R multiplication is insufficient.
What this means in practice
Select the 50% neutral. Relative Y stays at 0.5 while the white’s XYZ changes. That follows from normalization and constant reflectance, not a rule for every grey fabric.
The standard observer is not a camera sensor
The CIE 1931 2° functions define a standard colourimetric system. They are not the sensitivity curves of a particular camera’s three channels, nor simply three individual cone responses. The 2° designation concerns viewing conditions, not a lens, image resolution or the field of view of an entire shot.
A camera also reduces a spectral signal to a few channels, but with its own spectral sensitivities, optics, filters and processing. Two spectra matching for the standard observer need not match in raw camera responses. Profiles and matrices can reduce typical discrepancies; they do not reconstruct every possible spectrum from three values. A practical test needs the actual cameras and representative scene materials.
What this means in practice
When two camera bodies render a costume differently under one lamp, first align exposure, processing and balance. A remaining material-dependent difference is not automatically a gamma error.
Metamerism: a conditional match
Metameric stimuli have different spectra yet the same tristimulus coordinates under specified conditions. For reflecting materials, both illuminant and observer must be named: a match under one illuminant does not promise a match under another. Changing the conditions changes the weighting of spectral regions.
The laboratory pair is constructed mathematically. Opposite perturbations are added to two reflectances, with zero contribution to all three discrete D65 integrals. The reflectances stay between zero and one, but are not measurements of a commercial paint or fabric. Their exact match belongs to this sampling grid and model; it does not prove a match for every person, camera or integration method.
What this means in practice
Under D65, ΔE*ab is approximately zero. Under A a difference appears without changing either material curve. Illumination changes, not a stored “fabric colour” file.
Why white balance cannot replace a spectrum
White balance can align a neutral region, but it cannot retrospectively control spectral energy in the scene. If one lamp supplies little energy where two materials differ, the camera receives a different set of responses. Global channel gains may correct the neutral card while leaving errors in saturated objects.
In the TCS09 experiment, the same reflectance is integrated under D65 and the selected illuminant. Optional Bradford adaptation affects only the screen preview: it does not alter source XYZ or reconstruct the reflected spectrum. This separates a viewing-coordinate transform from a physical lighting change. Real scenes additionally introduce mixed illumination, specular reflection and camera limitations.
What this means in practice
Record a grey card and saturated red object under two sources. Compare the neutral first, then the object. A matched card alone does not establish equivalent lighting.
CCT and white chromaticity do not describe all the light
Correlated colour temperature summarizes a chromaticity near the Planckian locus. It does not list spectral peaks and gaps. Even identical white chromaticities allow many spectral distributions; a similar Kelvin label is therefore insufficient to promise identical material rendering.
D65 is a defined daylight illuminant, not any fixture labelled “6500 K.” Illuminant A likewise has a specified distribution. Our slider mixes two normalized spectra by proportion, not by Kelvin interpolation, and does not emulate a fixture’s CCT control. A real LED fixture may change channel mixture, spectrum and output as that control moves. Test its mode, dimming and modifiers in the actual working configuration.
What this means in practice
Record measured chromaticity, mode, distance, dimmer setting and comparison reference, not only “5600 K.” Otherwise the test is difficult to reproduce.
CRI: general Ra and special samples
In the traditional CIE method, general Ra averages the first eight test-colour results. It is not an average of every special index, nor a saturated-red index. R9 relates to TCS09 and is reported separately. “CRI 95” and “R9 95” therefore describe different parts of the assessment.
An index is the result of a specified method with a reference, observer and test-colour comparison. A high average does not mean zero error for every object and does not cover every production concern: stability, flicker, dimming, geometry or camera compatibility. Our laboratory shows TCS09 reflectance but does not implement the complete method. Neither its patch nor the metamer pair’s ΔE may be labelled CRI.
What this means in practice
Ask a supplier for the relevant individual results and measurement conditions, not just Ra. For a red costume, test the actual fabric even when R9 looks reassuring.
TLCI: a television-camera model
TLCI-2012 evaluates lighting for television practice through a camera-and-reproduction model. That differs from directly comparing spectra or evaluating through a standard visual observer. The model addresses problems relevant to television production, but it is not your specific sensor, RAW decoder and creative transform.
EBU recommendations discuss TLCI in the context of lighting equipment and its use. Comparing scores requires understanding the method and configuration. For a production using multiple cameras, supplement a model-based result with a shared chart, skin and representative-material shoot. The scale remains useful guidance, not a replacement for testing the complete production chain.
What this means in practice
If two cameras align in daylight but diverge under an LED source, do not begin with separate creative LUTs. First repeat a controlled shoot with matching technical settings.
SSI: name the spectral reference first
The Academy’s Spectral Similarity Index evaluates a spectral distribution against a chosen reference. The comparison itself is not tied to one particular camera. However, it still answers a question about spectral similarity, not universal aesthetic quality or guaranteed matching of every material.
A score without its reference is incomplete. A fixture may be close to one distribution and far from another; matching two fixtures to each other is another task again. Inconsistent reports cannot be compared as if their targets were identical. Nor can SSI be derived from CCT, white RGB or an eight-bit photograph of a spectrum. This chapter explains the metric’s purpose; the browser model does not calculate SSI.
What this means in practice
Write “SSI relative to …,” not an isolated number. When replacing one fixture in a scene, similarity to the remaining fixtures may matter more than similarity to a different laboratory reference.
How to read and repeat a spectral measurement
Check what the instrument measured: spectral irradiance at a point, directional radiance or light reflected by a sample. These are not interchangeable merely because their plots share a wavelength axis. A comparison needs units, range, sampling interval, spectral resolution, geometry and normalization. An overly coarse grid can miss narrow structure in a source.
Record warm-up, power, mode, dimming, distance, angle, optics and modifiers. Without those details, the result is harder to reproduce on another day. In our CSV, 5 nm is the teaching table’s sampling interval, not a real spectrometer’s specified resolution. The 380–780 nm truncation and quadrature are explicit; values can differ from a complete standard calculation.
What this means in practice
Keep the original numerical file alongside the report. A screenshot is useful for reading a spectrum but cannot replace data for reintegration.
A production test: neutral, skin and materials
Begin with an aligned technical chain: a single decode, known input, matched exposure and controlled output. Record a neutral, a chart and real scene objects—especially saturated fabrics, paints, cosmetics and potentially fluorescent materials. Check global balance separately from object-dependent differences.
Then compare sources or cameras while changing one factor at a time. Preserve versions without baked creative transforms and note what remains after basic alignment. If the issue originates in the physical light, changing the source, mode or fixture combination may be more robust than correcting every object separately. A numerical metric narrows the search; the controlled scene tests the actual result.
What this means in practice
After neutral alignment, compare the same costume region across shots. Label what changed: light, balance, exposure or transform. Otherwise the cause becomes ambiguous.
What this experiment demonstrates—and what it does not
The experiment establishes that different reflectances can match in one discrete colourimetric calculation and diverge when the illuminant changes. Separately, it shows the behaviour of published TCS09 data. Those data types are not conflated: observer functions, illuminants and the sample are tabulated; the metameric pair is constructed algorithmically.
Patches follow a fixed sRGB preview path, optionally with Bradford adaptation. Display clipping does not change XYZ or ΔE*ab. The lab contains no real camera sensitivities, TLCI camera model, complete CRI or SSI calculation, individual-vision simulation or monitor-match guarantee. To apply the lesson in production, preserve the conditions and repeat the check with your equipment.
What this means in practice
Disable Bradford. Patches change while source XYZ and the pair’s ΔE remain unchanged. This tests separation of calculation and display, not “disabling visual adaptation.”
A MODEL YOU CAN CHECK
Different questions about one source
Keep the meaning, the calculation and the limitation together.
X,Y,Z = k Σ E(λᵢ) R(λᵢ) [x̄ᵢ,ȳᵢ,z̄ᵢ] Δλ ; k = 1 / Σ E(λᵢ) ȳᵢ ΔλΔλ = 5 nm over 380–780 nm; a perfect diffuser has Y = 1. A relative discrete model of an opaque, nonfluorescent material—not absolute photometry.
| Concept | What it describes | What not to conclude |
|---|---|---|
| SPD | Radiation across wavelengths with stated units and normalization. | A graph without geometry and units is insufficient for absolute comparison. |
| White point / CCT | Coordinates or a compact description of chromaticity. | They do not reconstruct a unique spectrum. |
| Ra | General result for the first eight traditional CRI samples. | It does not include special R9 in that average. |
| R9 | A separate TCS09 result within the CRI method. | It is not the appearance of a browser’s red patch. |
| TLCI | The result of a specified television model. | Not a guarantee for every sensor. |
| SSI | Spectral similarity to a named reference. | Not a universal scale of aesthetic quality. |
| Lab ΔE*ab in this lab | Difference between two samples sharing the current white. | Not CRI, SSI or lighting certification. |
DO. OBSERVE. EXPLAIN.
Find the cause without changing the material
Start with the metamer pair under D65. A production check needs actual chart/material footage under two sources; the browser does not replace it.
- 01
Establish the match
Choose the metamer pair under D65 and inspect the numbers. Compare the two reflectances and XYZ.
CHECKThe curves differ while XYZ matches to the model’s numerical precision.
- 02
Change only the illumination
Move to A without changing material, observer or normalization. Record the result, then return to D65.
CHECKThe difference appears and disappears reversibly while materials remain unchanged.
- 03
Separate preview processing
Under A, disable and re-enable Bradford. Then select TCS09 and compare its relative Y under the two illuminants.
CHECKPreview appearance can change without source XYZ changing; TCS09 is not substituted for the metamer pair.
- 04
Repeat with a production scene
Shoot a neutral and representative materials under two real sources. Record modes, exposure, decoding and output.
CHECKThe report separates spectral measurement, camera, visual comparison and the chosen metric.
Check your understanding
TEST THE EXPLANATION
A situation, not a trick question.
Answer first. Open the reasoning afterwards.
01Both lamps say “5600 K.” Why does fabric differ?+
CCT does not specify the spectrum. First exclude exposure and processing differences, then compare source and material. A white card checks the neutral, not every spectral interaction.
02Can the pair’s ΔE be labelled CRI?+
No. This is a difference between two samples under a common white. CRI has its own sample set, reference and procedure; one difference does not implement it.
03The patches look closer after Bradford. Is the light fixed?+
No. The coordinate preview path changed. Spectra, source XYZ and physical illumination did not. Check pre-adaptation data and do not treat a screen result as a modified lamp.
Avoid these shortcuts
- Similar Kelvin labels do not establish similar spectra.
- A D65 match does not promise a match under other light.
- The pair’s ΔE, CRI, TLCI and SSI are not interchangeable.
From the model to your workflow.
In Resolve, first align input, exposure and technical output. Do not use a separate creative LUT as the first explanation for lighting differences. A camera-specific assessment needs its actual recordings; the spectral lab illustrates a possible cause, not a ready-made sensor correction.
CHECK THE FOUNDATION
Sources and model limits.
Editorial review: 2 October 2026. Links identify the definitions and formulas; exercises are independent teaching examples.
- [1]CIE · 1931 colour-matching functions, 2° ↗
Official CIE 1931 colour-matching dataset; DOI 10.25039/CIE.DS.xvudnb9b. The lab uses a separate 5 nm excerpt, not the complete CIE file.
- [2]CIE · Standard illuminant D65 ↗
Tabulated D65 distribution; DOI 10.25039/CIE.DS.hjfjmt59. A standard illuminant is not a measurement of a particular lamp.
- [3]CIE · Standard illuminant A ↗
Standard illuminant A; DOI 10.25039/CIE.DS.8jsxjrsn. Both illuminants are normalized using a perfect reflecting diffuser in the experiment.
- [4]CIE · 14 test samples for colour rendering ↗
Test-sample data; DOI 10.25039/CIE.DS.wuiuu9cz. TCS09 is used, but neither R9 nor Ra is computed here.
- [5]Colour · Numerical tables and attribution ↗
Numbers transcribed from the Colour project tables: cmfs.py, illuminants/sds.py and quality/datasets/tcs.py. 380–780 nm, 81 samples. Source links, changes and licences are in the attribution file; the numerical CSV is available by the lab.
- [6]CIE · Colour-rendering properties of light sources ↗
Method description and test samples. General Ra and special indices are not the same quantity.
- [7]EBU · Recommendation R 137 ↗
EBU recommendation on television lighting, TLCI-2012 and TLMF. The model is not a guarantee for every camera.
- [8]Academy · Spectral Similarity Index ↗
SSI compares a spectrum with a chosen reference. Spectral similarity does not promise identical results for all cameras and materials.
- [12]ICC · sRGB registry ↗
Piecewise sRGB transfer function, primaries and D65. It is applied to colour components, not alpha.
- [13]ICC · Chromatic adaptation tag ↗
A linear Bradford matrix is used solely for the fixed D65 preview in the spectral experiment.